
How to visualize interactions between humans, materials, and other beings?
In order to understand what interspecies creativity is, I examined, through the lens of embodied cognition, how participants, organisms, and materials acted and related with each other, changed over time, and contributed to the production of something new.
Time is an essential dimension of embodied cognition. Cognition is said to emerge from moment-by-moment goal-directed interactions between organisms and their environment (Thompson, 2007). Over time, these material engagements lead to the reciprocal refinement of organisms’ bodily structures and their ecological niches for a better fit. Likewise, time has been a central dimension of creativity research and the study of productive processes (see Mainemelis, 2002). Time reveals change which is fundamental to understanding how forms unfold through the interaction between material bodies.
Time is particularly relevant for the study of biomaking. Asgarali-Hoffman & Hamidi (2021) found that biodesigners dealt with high unpredictability given that their work involves organisms that constantly change and develop at different time scales. In order to better understand how to synchronize cacophonous rhythms, this analysis aims to visualize interspecies participation in creative production.
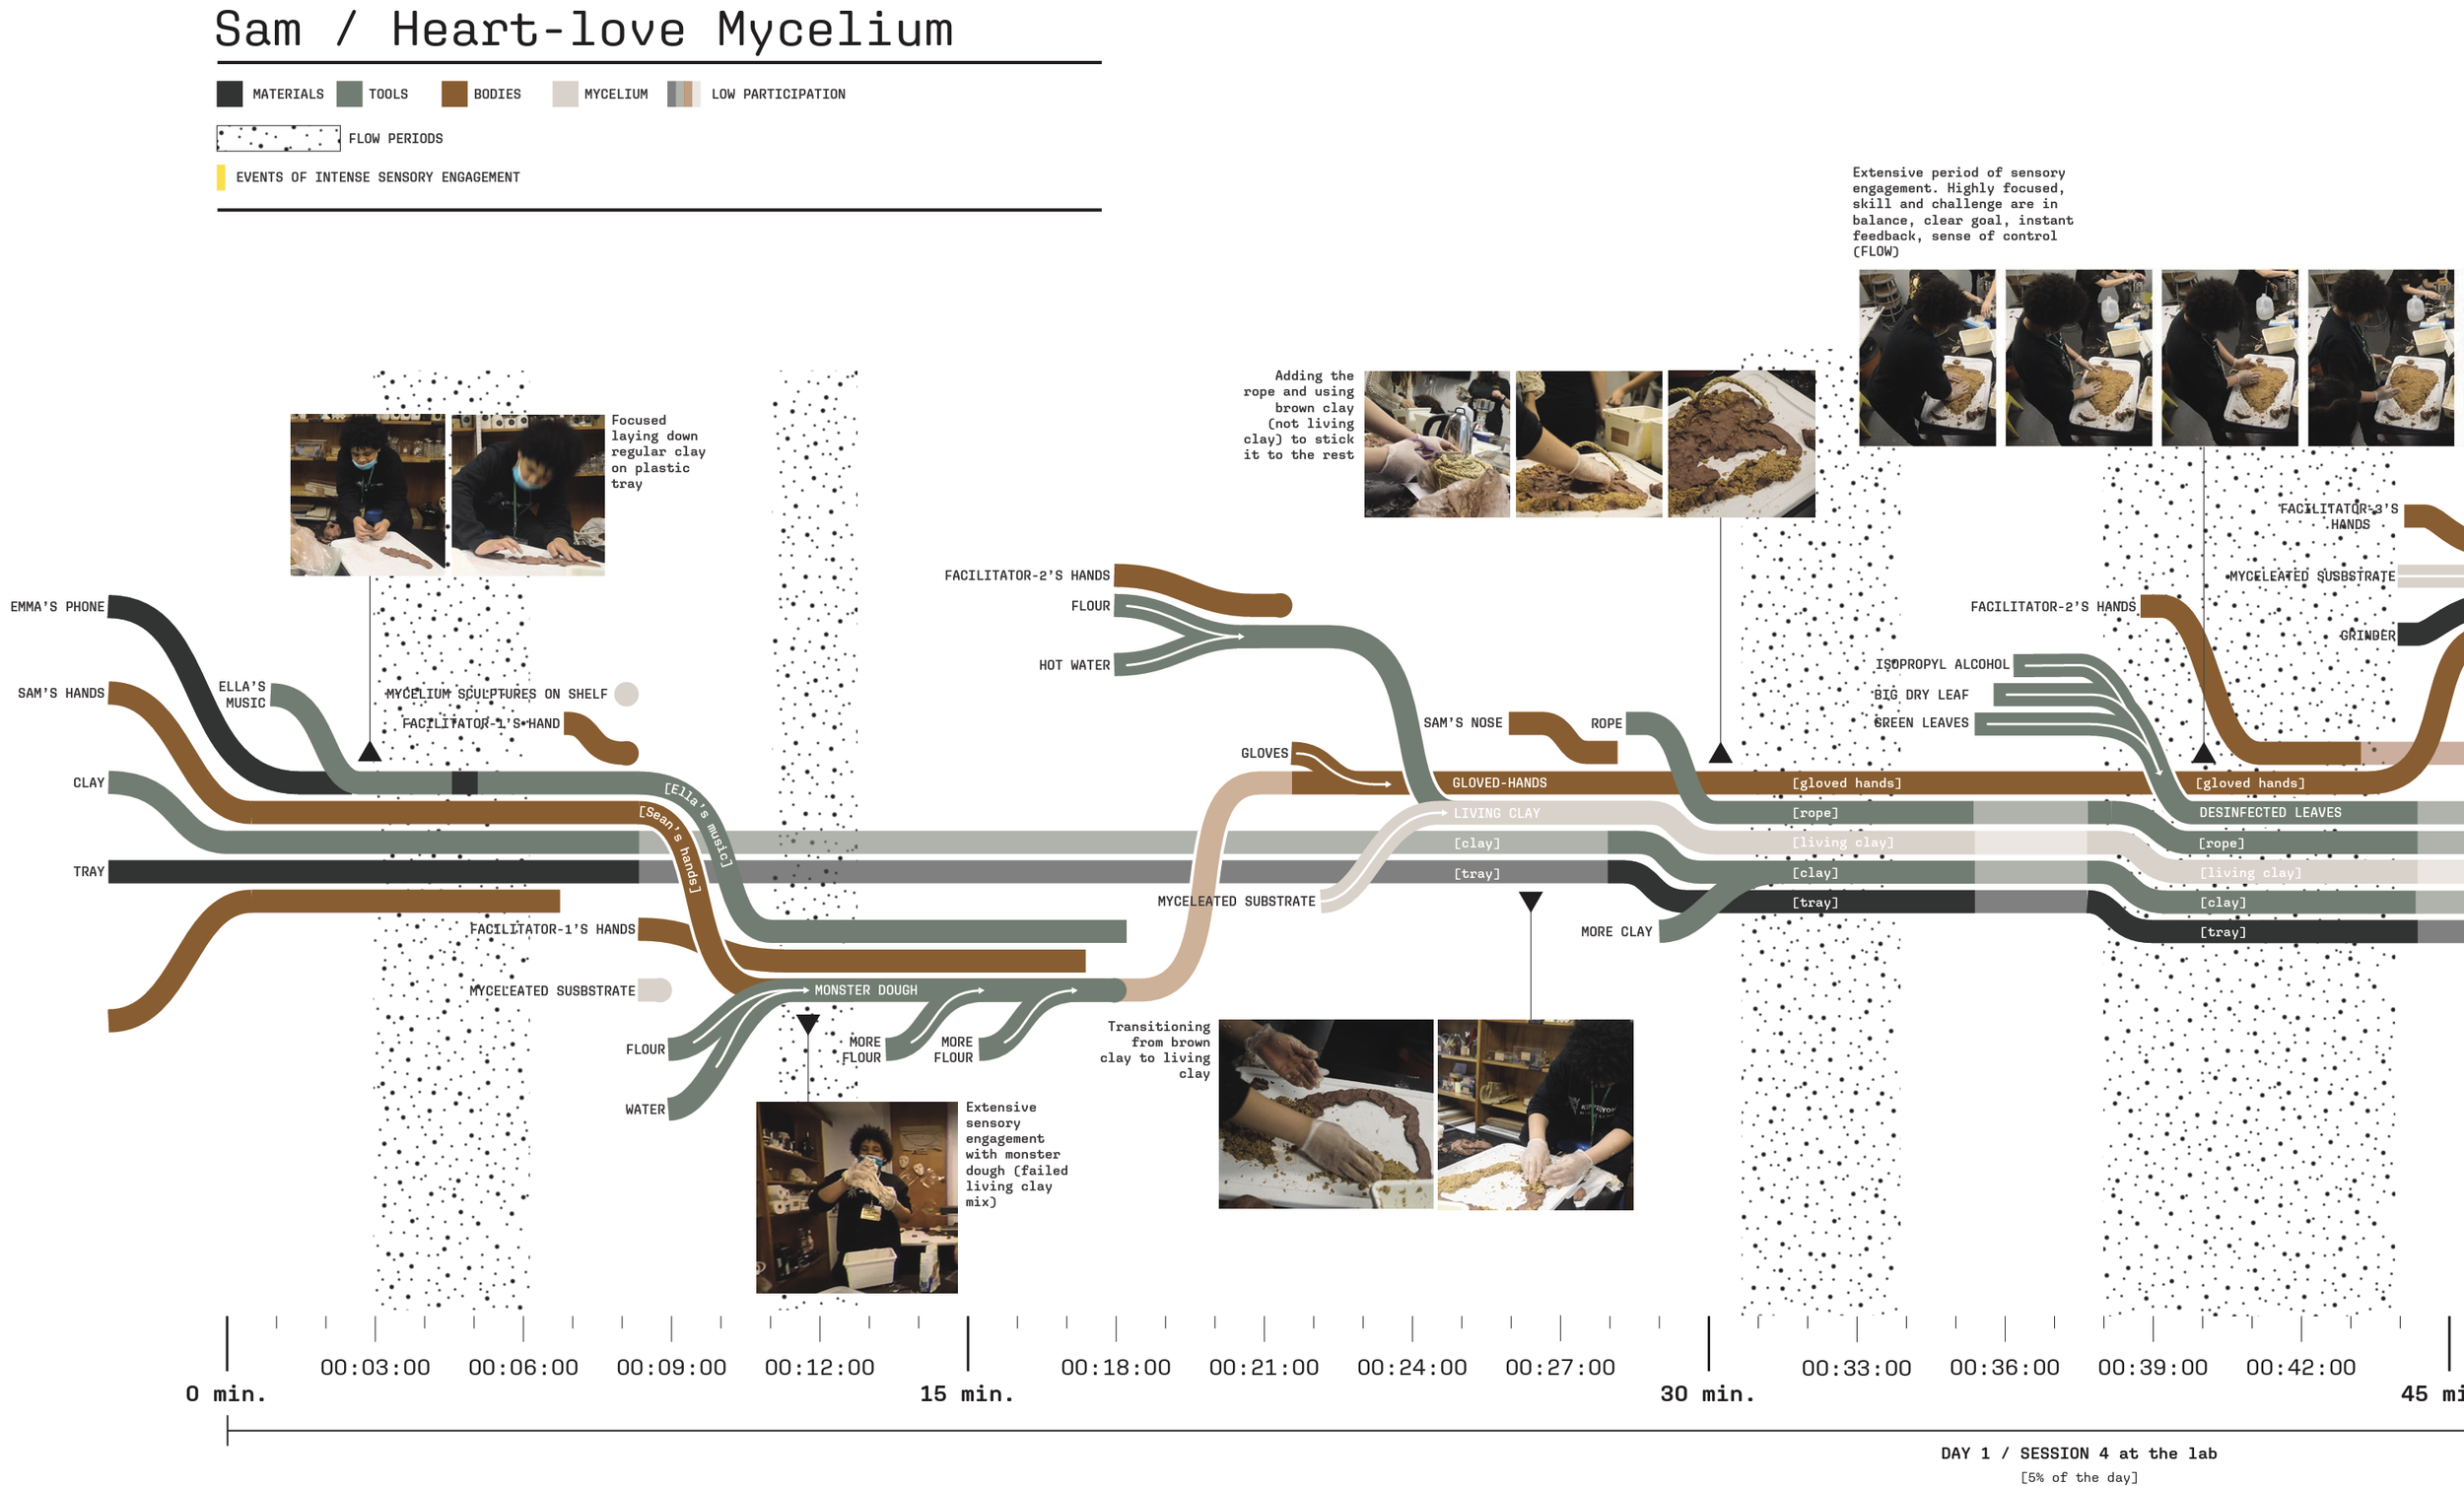

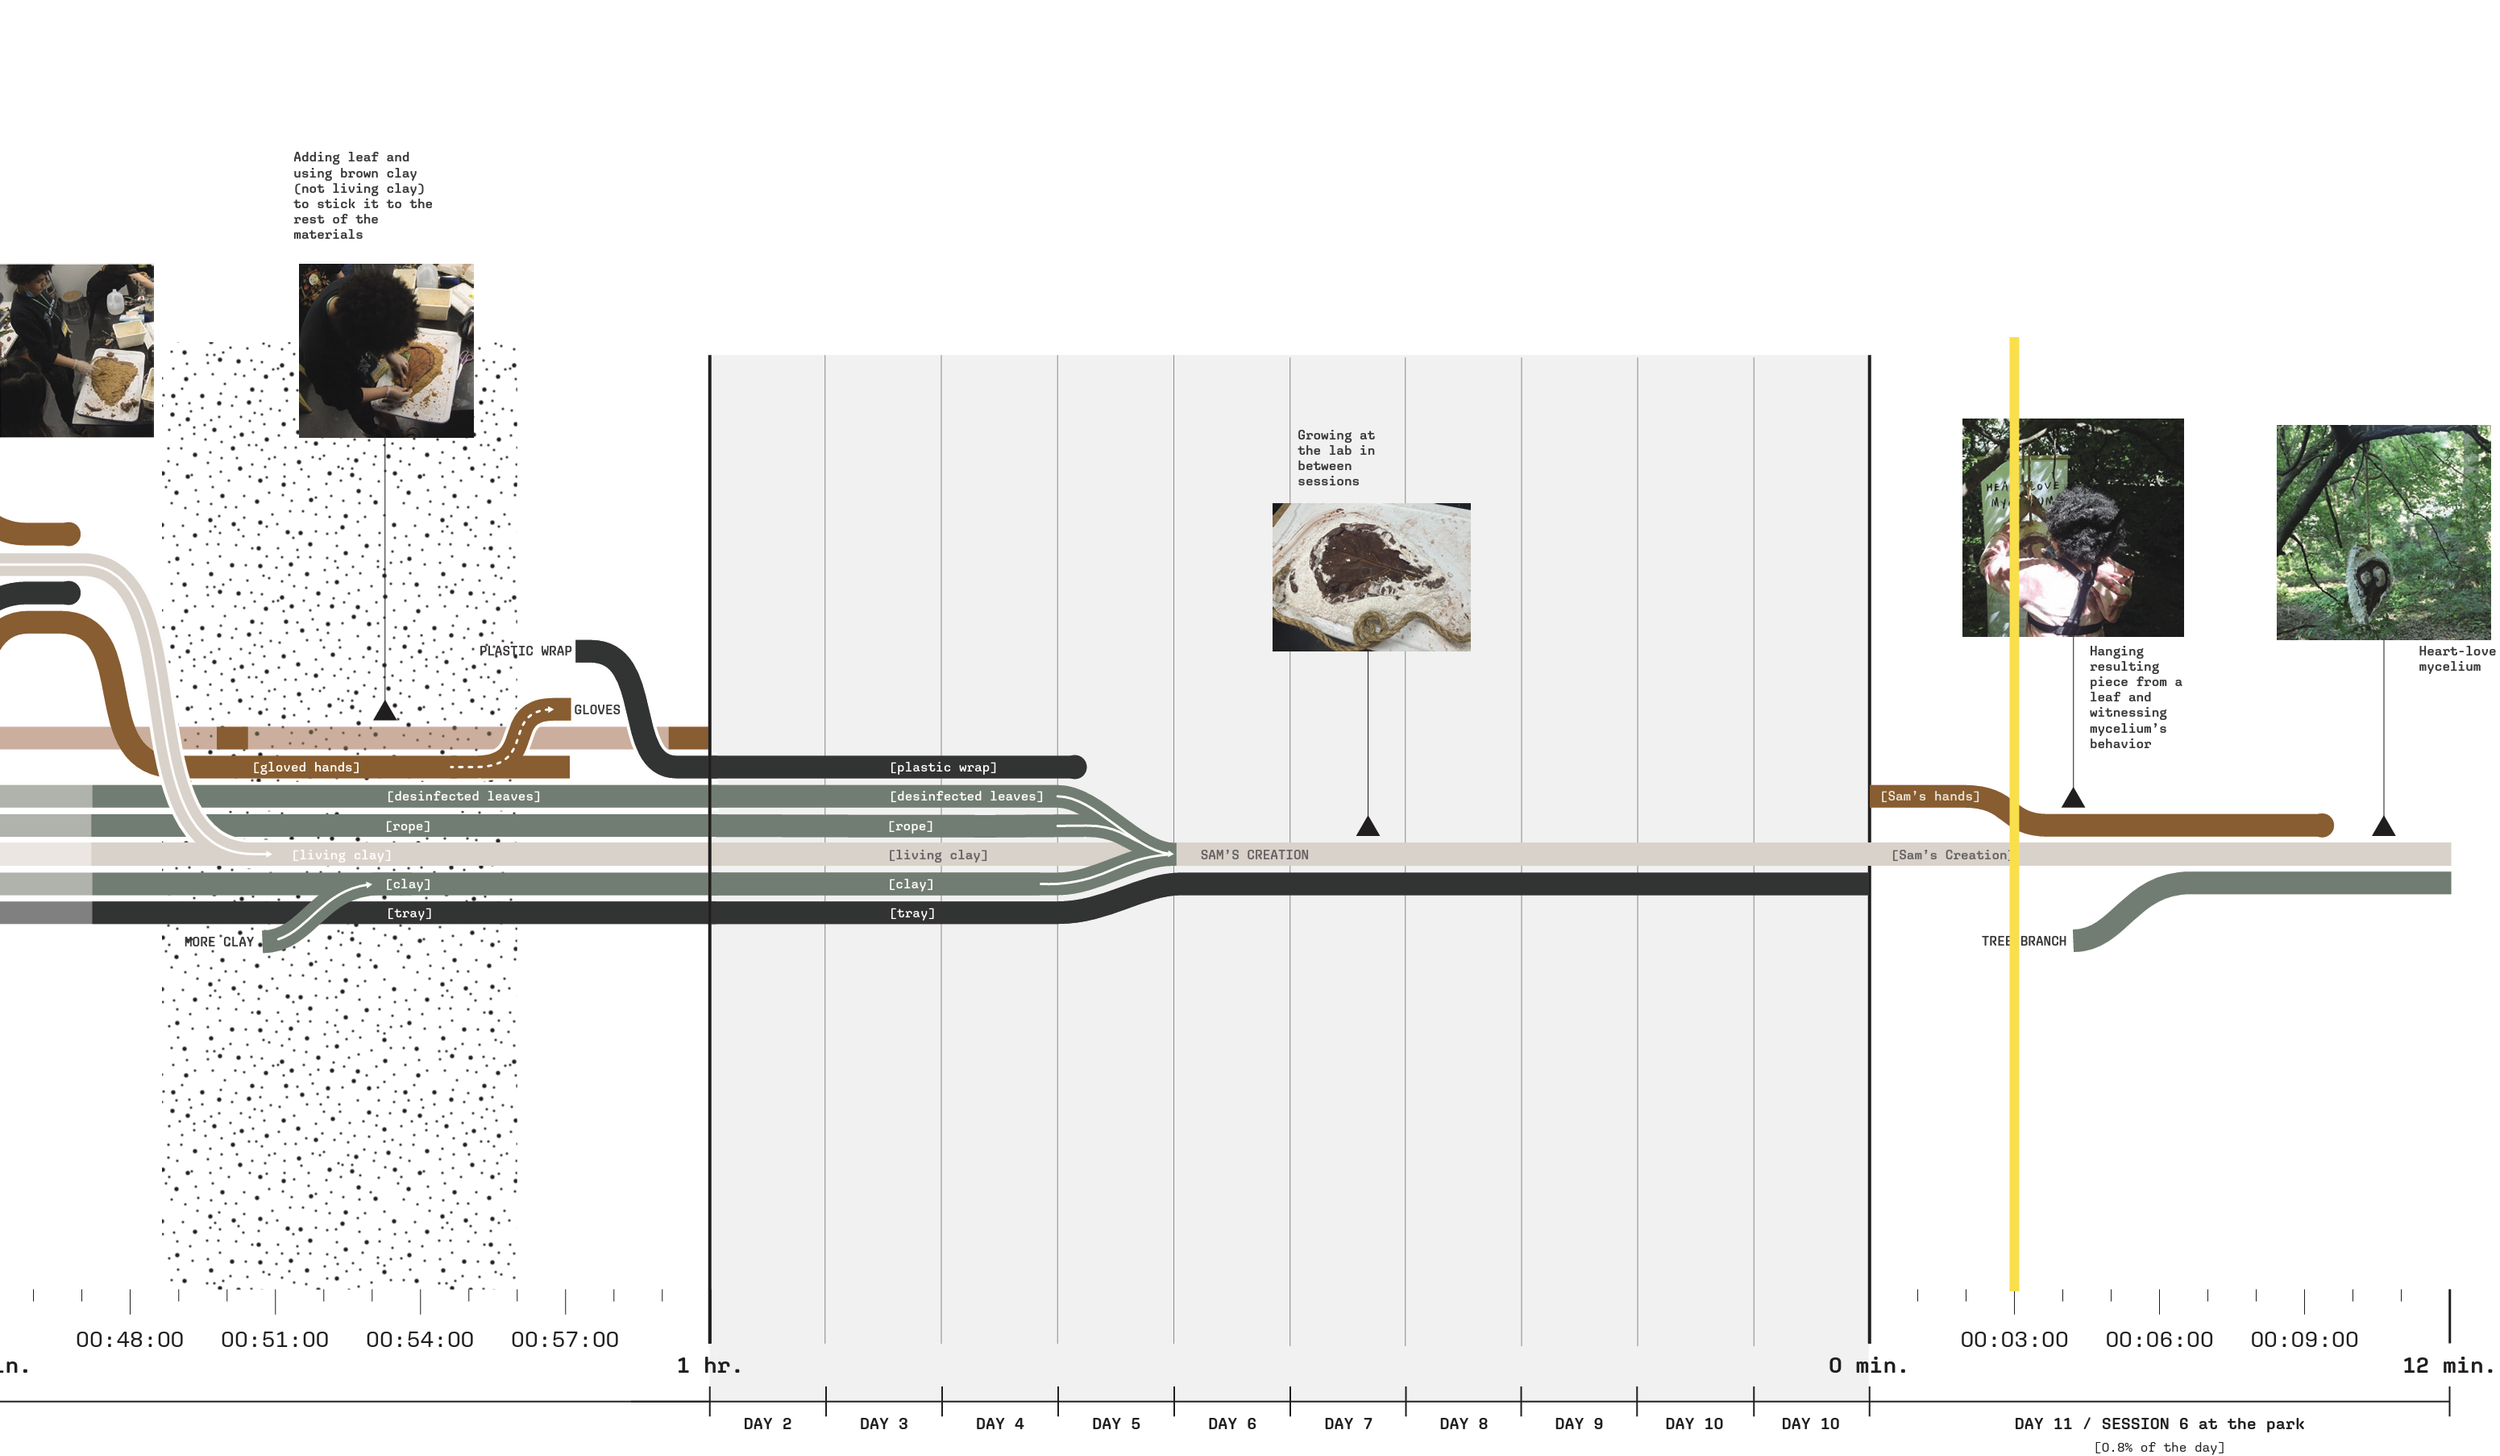
The time-based analysis I advance here aims to acknowledge human and non-human material contributions to form-giving. Transformations at different scales are observed according to their own timeframes to appreciate human actions along with the more subtle interventions of the organism. To that end, I developed a series of material flow diagrams illustrating the moment-to-moment encounters between bodies and materials. Material flow diagrams are inspired by Sankey diagrams (which display flows of materials, energy, or costs in the form of arrows that have a width proportional to the quantity visualized) and stream graphs (that display changes over time). Combining features of both, material flows are distinctive in that they display how materials assemble over time, leading to production.
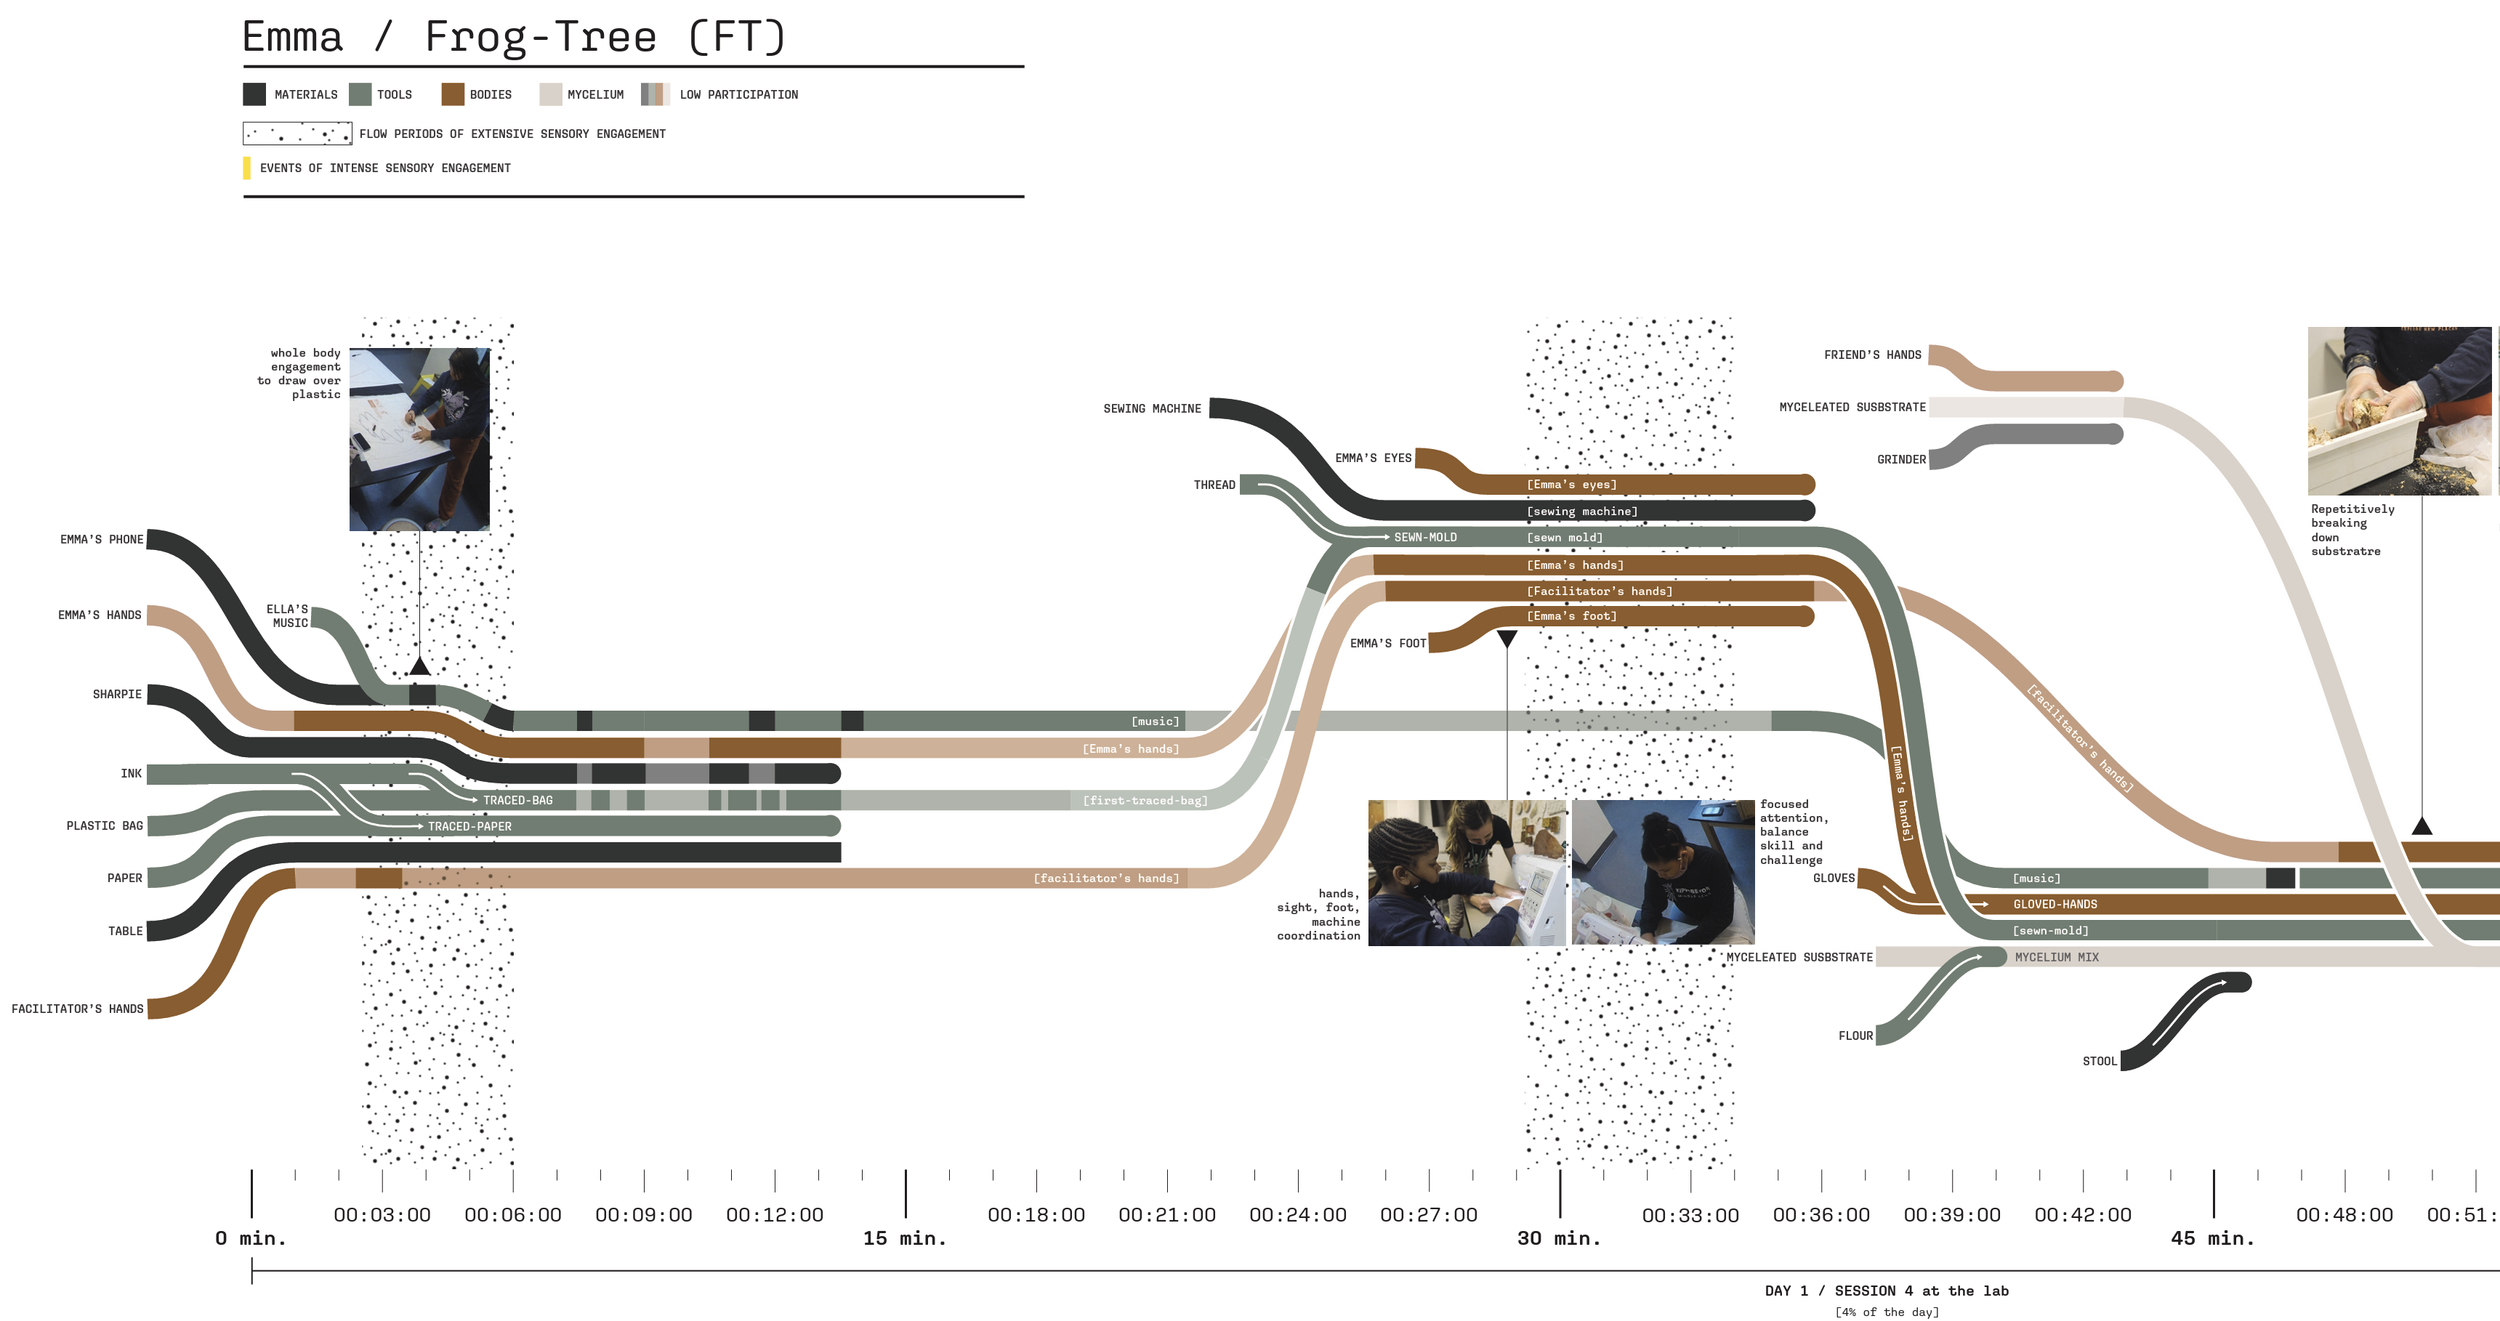
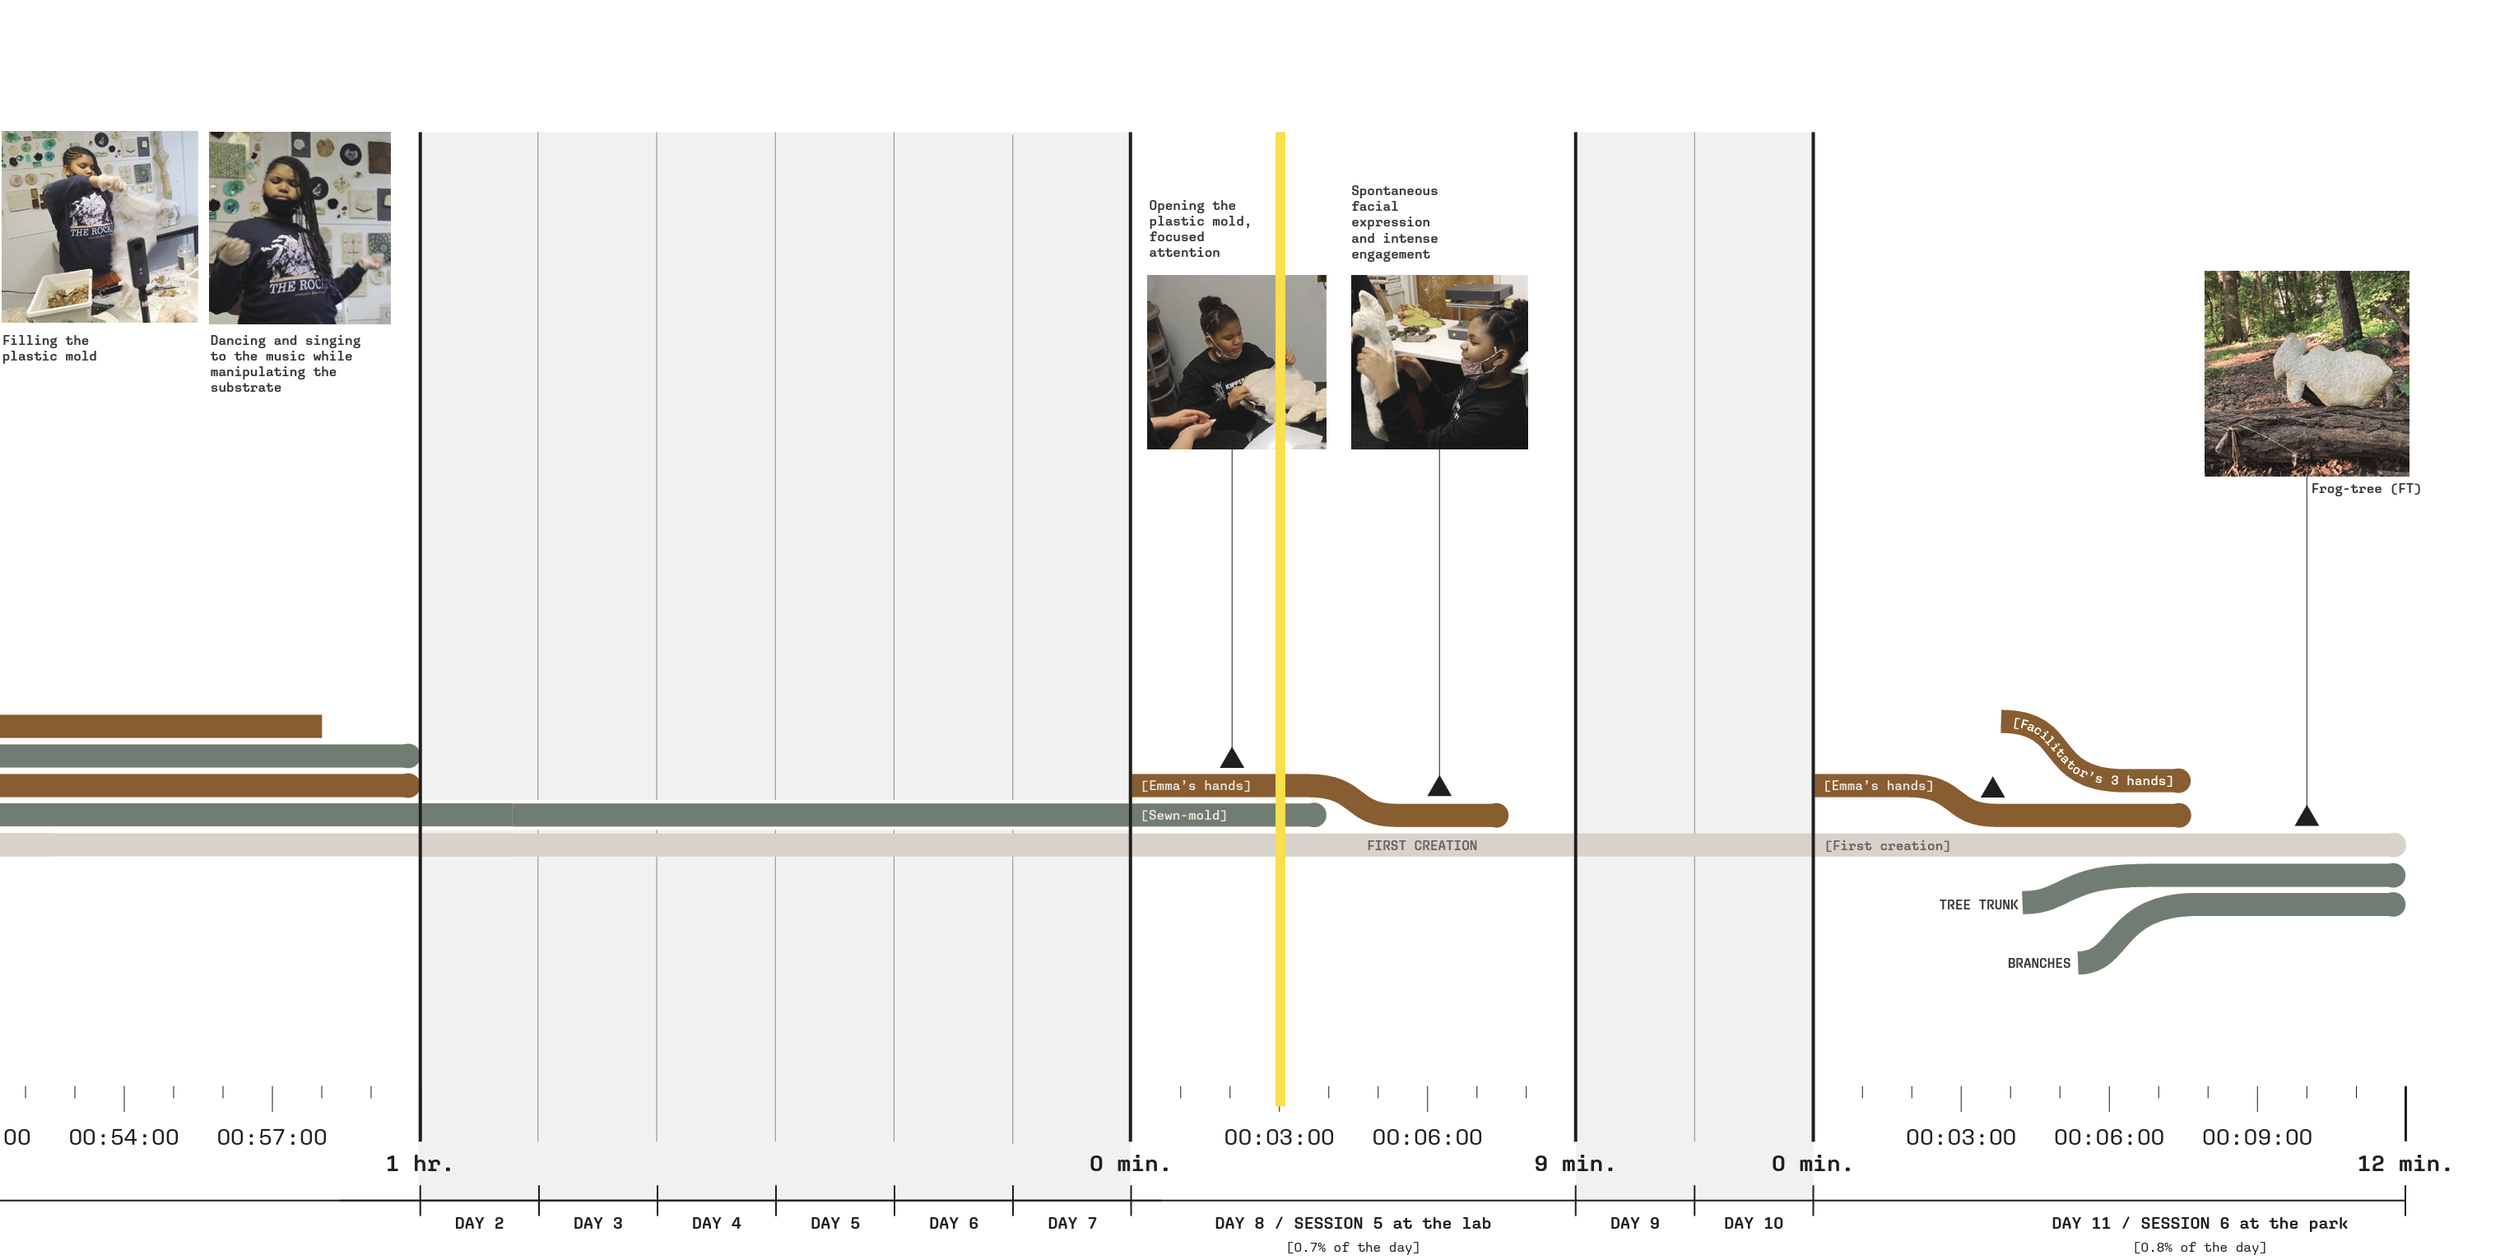
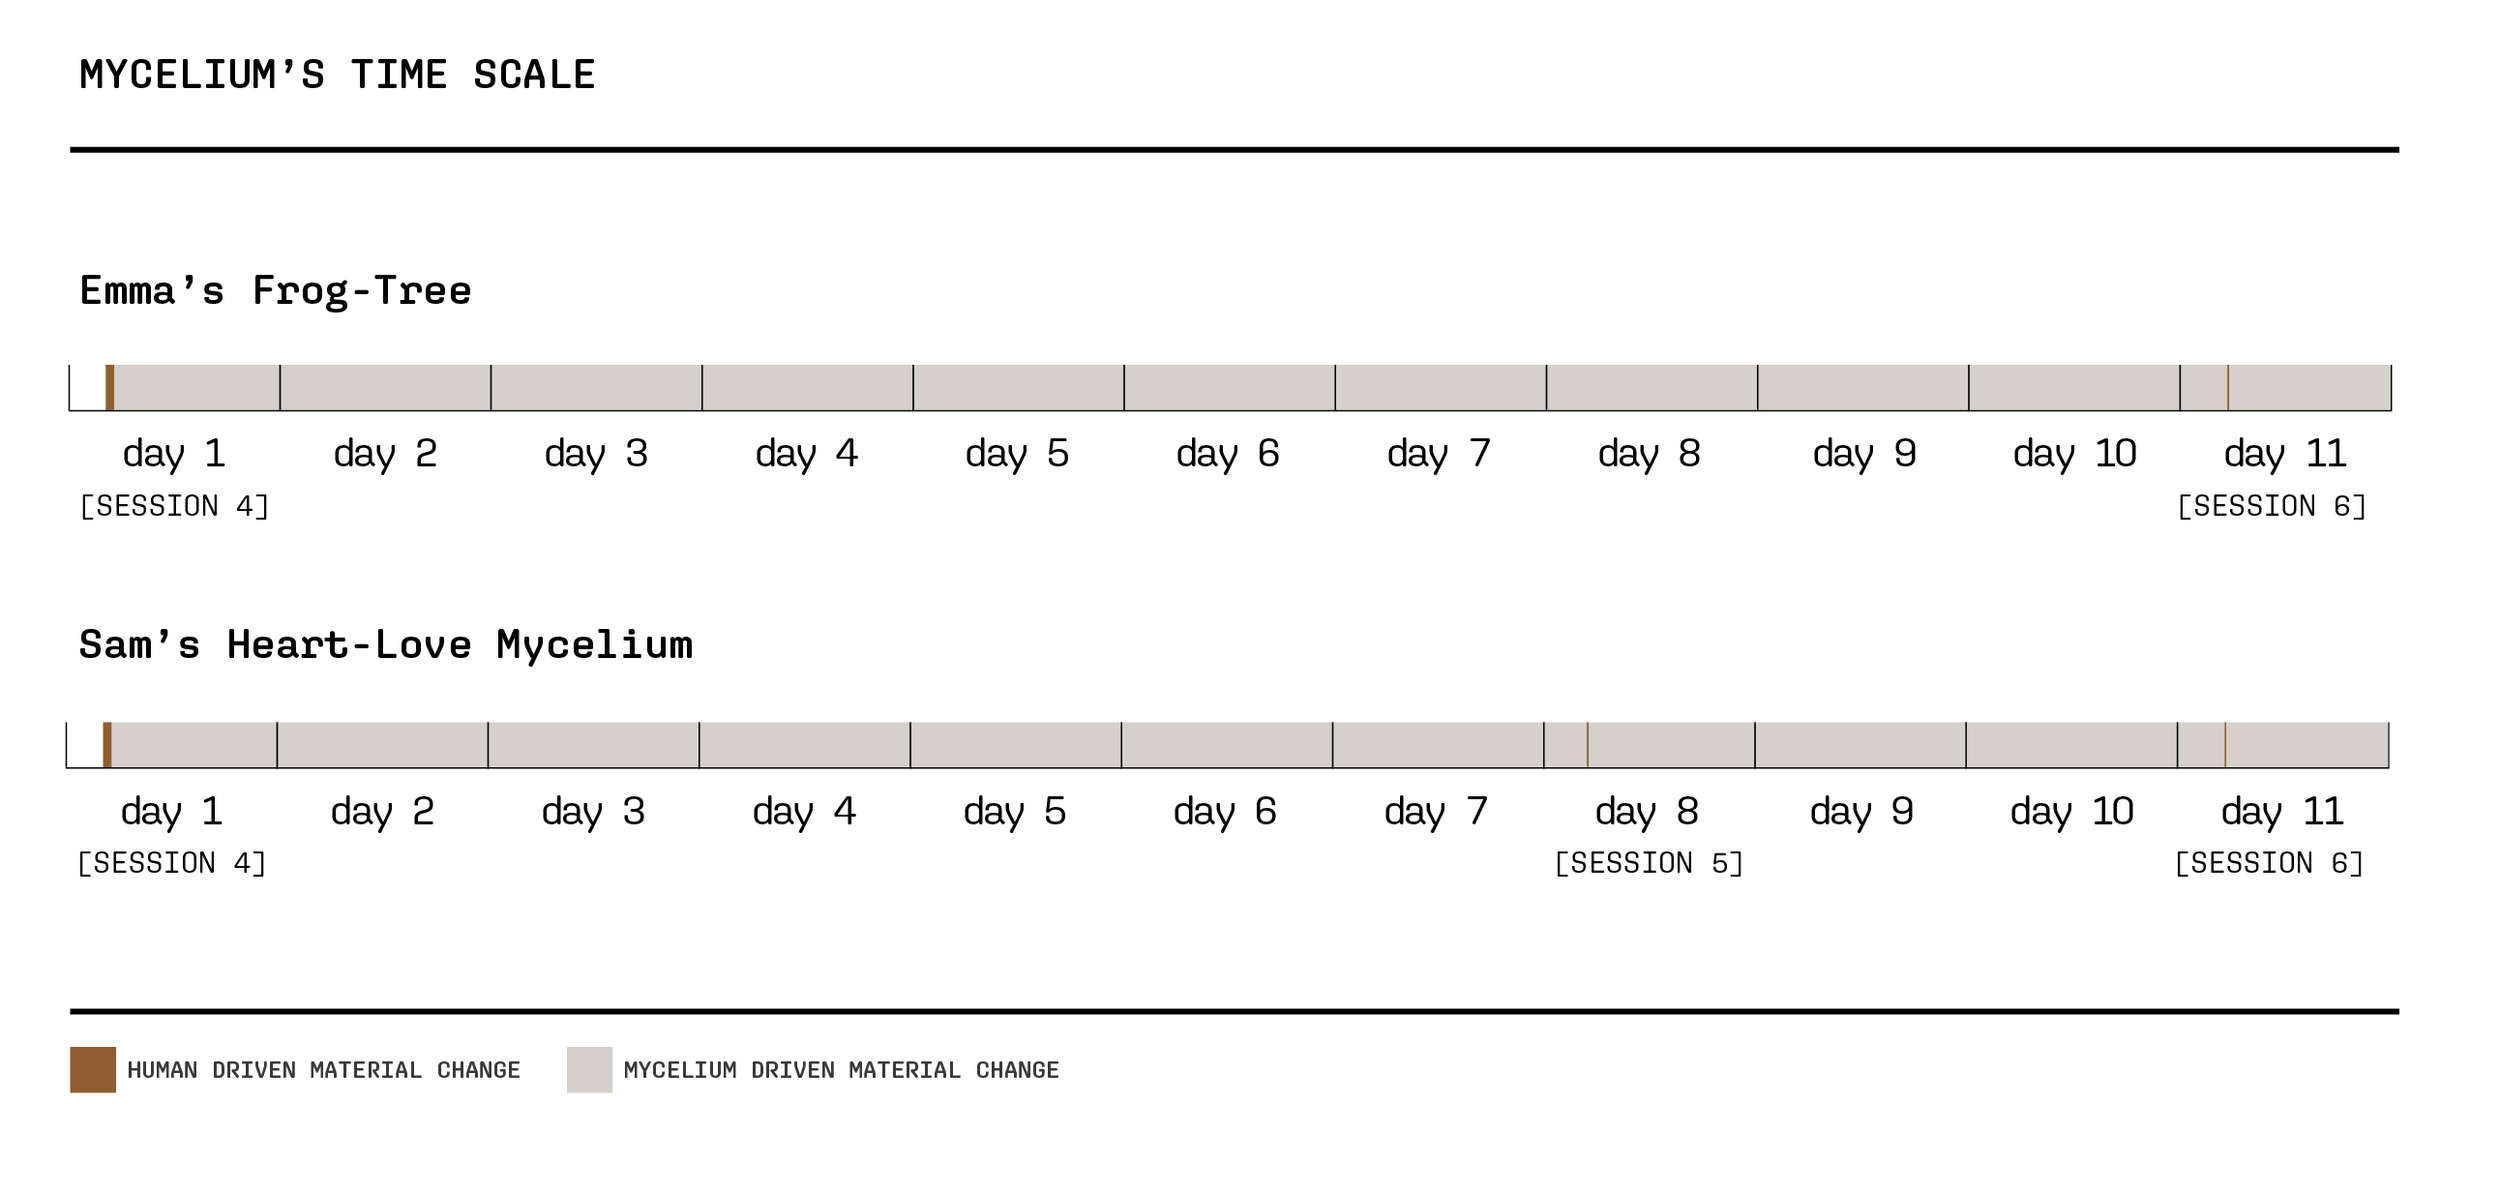
Time is the central organizing unit of the material flow diagram, and it is presented in two ways to contrast a human-centric conception of time and mycelium timeframe of development. The human-centric timeline was used for the larger diagrams (above). Making sessions are displayed in minute-long units, while the periods between sessions are condensed and displayed in day-long units. To better account for mycelium’s work between sessions, the mycelium-centric timeline is displayed below. This timeline uses day-long units and displays proportionally the amount of time in which mycelium was the leading actor driving material transformation (in light gray) versus in which human engagement was dominant (in brown).
Material flow diagrams display assemblages of material bodies over time. Recall that material body is a broad term encompassing human material bodies, living materials, material instruments, and conventional materials. Material bodies tend to gather into assemblages that are distinctive in their capacity to produce something new. The visual representation of assemblages over time reveals what material bodies enter and come out from each assemblage. It also reveals how assemblages are scattered throughout the process.
The flows portray an admittedly simplified conception of an assemblage, for they cannot be reduced to the elements materially present in one particular moment but are rather folds of time. For example, the student’s hands bring to one moment previous experiences working with other similar materials, and the researcher reading an assemblage also joins the moment from another point in time. However, they provide an entry point for these considerations.
Lines represent the material bodies involved in the process; green lines correspond to materials, blue lines are tools, and brown lines represent the bodies of people and other organisms except for mycelium, represented in light gray. Each color also has a lower tone to represent instances in which entities had non or little engagement with each other yet will continue to be relevant later in the process. Lines were drawn closer to each other when there was interaction between material bodies. At times, two or more material bodies collide and produce a new entity such as a new material or thing (e.g., a line representing water and a line representing flour collide into one that represents dough) or a jointed entity in which more than one entity work together as one (e.g., hands and gloved hands collide into gloved hands). As a result, the material flow diagrams visualize how assemblages emerge, dissolve, and contribute to the production of something new.
To cite this work:
Correa, I. (2023). Interspecies creativity: A life-centered framework for maker education [Doctoral dissertation]. Teachers College, Columbia University.